Global RTOFS is a data-assimilated product from NOAA’s Environmental Modeling Center.
This tutorial came from here (bottom of page): http://polar.ncep.noaa.gov/global/examples/usingpython.shtml
Dependencies: netcdf4-python and Basemap
First you need to download the data from one of the directories here: http://nomads.ncep.noaa.gov/pub/data/nccf/com/rtofs/prod/
Then run the following code (after updating the “file name”)
# For original tutorial, see (bottom of page): This tutorial came from here (bottom of page): http://polar.ncep.noaa.gov/global/examples/usingpython.shtml
from mpl_toolkits.basemap import Basemap
import numpy as np
import matplotlib.pyplot as plt
from pylab import *
import netCDF4
plt.figure()
nc = '/data/SSTlobster/RTOFS/rtofs_glo_3dz_n048_daily_3ztio.nc'
# In this example we will extract the surface temperature field from the model.
# Remember that indexing in Python starts at zero.
file = netCDF4.Dataset(nc)
lat = file.variables['Latitude'][:]
lon = file.variables['Longitude'][:]
data = file.variables['temperature'][0,0,:,:]
file.close()
#There is a quirk to the global NetCDF files that isn't in the NOMADS data, namely that there are junk values of longitude (lon>500) in the rightmost column of the longitude array (they are ignored by the model itself). So we have to work around them a little with NaN substitution.
lon = np.where(np.greater_equal(lon,500),np.nan,lon)
#Plot the field using Basemap. Start with setting the map projection using the limits of the lat/lon data itself
m=Basemap(projection='mill',lat_ts=10, \
llcrnrlon=np.nanmin(lon),urcrnrlon=np.nanmax(lon), \
llcrnrlat=lat.min(),urcrnrlat=lat.max(), \
resolution='c')
#Convert the lat/lon values to x/y projections.
x, y = m(lon,lat)
#Plot the field using the fast pcolormesh routine and set the colormap to jet.
cs = m.pcolormesh(x,y,data,shading='flat', \
cmap=plt.cm.jet)
#Add a coastline and axis values.
m.drawcoastlines()
m.fillcontinents()
m.drawmapboundary()
m.drawparallels(np.arange(-90.,120.,30.), \
labels=[1,0,0,0])
m.drawmeridians(np.arange(-180.,180.,60.), \
labels=[0,0,0,1])
#Add a colorbar and title, and then show the plot.
colorbar(cs)
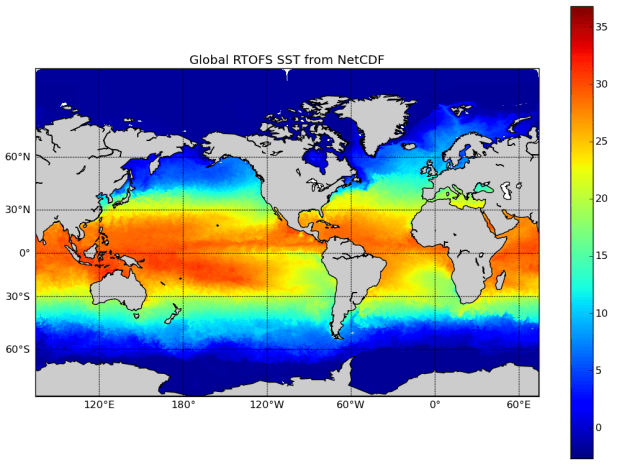
plt.title('Global RTOFS SST from NetCDF')
plt.show()

MAC USERS: For hints on how to install the required matplotlib and netcdf4… see the following comments:
It appears a KeyErrow establishing
data = file.variables[‘temperature’][0,0,:,:]
tried different str like ‘temp’, ‘sst’ and ‘t’
please help
running on Os X Yosemite – Jupyter Terminal Launcher
Beginner
ValueError: x and y arguments to pcolormesh cannot have non-finite values or be of type numpy.ma.core.MaskedArray with masked values
I found the same error – please help!