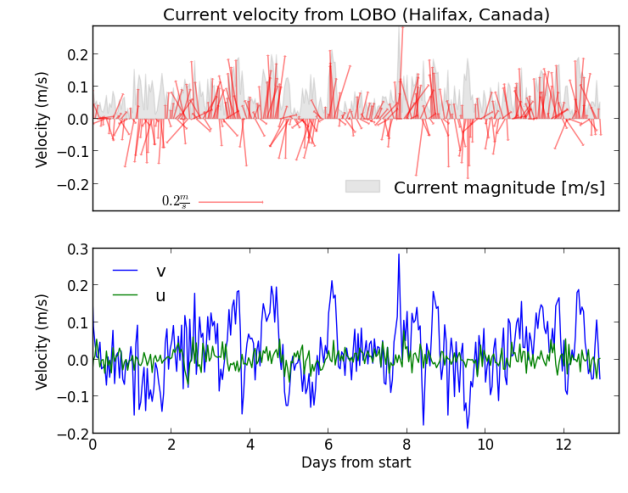
Here we plot surface currents from the Satlantic LOBO ocean observatory moored in the North West Arm (Halifax, Nova Scotia, Canada). We used a 1D quiver plot… often used to represent magnitude and direction of currents at a particular location.
import urllib2
import StringIO
import csv
import numpy as np
from datetime import datetime
import matplotlib.pyplot as plt

startdate = '20070518'
enddate   = '20070530'

# Read data from LOBO buoy
response = urllib2.urlopen('http://lobo.satlantic.com/cgi-data/nph-data.cgi?min_date='
                           +startdate+'&max_date='+enddate+'&y=current_across1,current_along1')
data = StringIO.StringIO(response.read())
r = csv.DictReader(data,dialect=csv.Sniffer().sniff(data.read(1000)))
data.seek(0)

# Break file into three lists
date, u, v = [],[],[]
for row in r:
    date.append(row['date [AST]'])
    u.append(row['current across channel [m/s]'])
    v.append(row['current along channel [m/s]'])

# Change the time strings into datetime objects
# ...and calculate 'decday' (i.e. "days from start")
datestart = datetime.strptime(date[1],"%Y-%m-%d %H:%M:%S")
DATE,decday = [],[]
for row in date:
    daterow = datetime.strptime(row,"%Y-%m-%d %H:%M:%S")
    DATE.append(daterow)
    decday.append((daterow-datestart).total_seconds()/(3600*24))

# Convert lists to numpy arrays
u = np.array(u, dtype=float)
v = np.array(v, dtype=float)

# Plot the output ************************************************************
# Plot quiver
fig1, (ax1, ax2) = plt.subplots(2,1)
magnitude = (u**2 + v**2)**0.5
maxmag = max(magnitude)
ax1.set_ylim(-maxmag, maxmag)
fill1 = ax1.fill_between(decday, magnitude, 0, color='k', alpha=0.1)

# Fake 'box' to be able to insert a legend for 'Magnitude'
p = ax1.add_patch(plt.Rectangle((1,1),1,1,fc='k',alpha=0.1))
leg1 = ax1.legend([p], ["Current magnitude [m/s]"],loc='lower right')
leg1._drawFrame=False

# 1D Quiver plot
q = ax1.quiver(decday,0,u,v,
               color='r',
               units='y',
               scale_units='y',
               scale = 1,
               headlength=1,
               headaxislength=1,
               width=0.004,
               alpha=0.5)
qk = plt.quiverkey(q,0.2, 0.05, 0.2,
               r'$0.2 \frac{m}{s}$',
               labelpos='W',
               fontproperties={'weight': 'bold'})

# Plot u and v components
ax1.axes.get_xaxis().set_visible(False)
ax1.set_xlim(0,max(decday)+0.5)
ax1.set_title("Current velocity from LOBO (Halifax, Canada)")
ax1.set_ylabel("Velocity (m/s)")
ax2.plot(decday, v, 'b-')
ax2.plot(decday, u, 'g-')
ax2.set_xlim(0,max(decday)+0.5)
ax2.set_xlabel("Days from start")
ax2.set_ylabel("Velocity (m/s)")
# Set legend location - See: http://matplotlib.org/users/legend_guide.html#legend-location
leg2 = plt.legend(['v','u'],loc='upper left')
leg2._drawFrame=False
plt.show()

# Save figure (without 'white' borders)
plt.savefig('1D_quiver.png', bbox_inches='tight')


Pingback: Day kind clicks in quiver piece|matplotlib | CodersDiscuss.com